It’s not unusual for me to hear people say you can’t go wrong with real estate. And many people feel it’s a better investment than the stock market. Frequently people will say it’s a safer investment. While real estate can be a good addition to a portfolio, it does not come without risks.
I think one reason people feel real estate is “safer” than investing in the stock market is because of the availability of price information. With the stock market, we can see movement in prices every second when the market is open. News channels frequently run a ticker at the bottom of the screen so you can follow every tiny movement in the market. With stocks each share of a company’s stock is the same as every other and there is an active market of buyers and sellers. So, you know precisely what your shares are worth at any given moment. With real estate, we don’t really know the price of a specific property unless we get an appraisal. Even an appraisal is just a guess. The only true way to determine the value of property is to put it on the market and see what kind of offers you receive. Of course, we get some indication of the value of property when we see other property in the neighborhood up for sale, when you get your annual property tax assessment, or when Zillow sends you an email claiming to know the value of your property.
The other reason many people prefer real estate is because they feel they understand it better. Real estate is a physical thing we see around us every day. We live in it, so we are more comfortable with it. Stocks are abstract. Back in the day you got a stock certificate representing your ownership interest in a company. Now, stocks are just numbers on a screen or a statement. There is a big separation between the representation of your ownership and the actual thing: a company. Plus, it is hard to put your hands on a company or walk around in a company like you can a house. Of course, we can see some of the physical products created by a company. We can walk into a store and touch the goods companies make. We drive cars and use smartphones made by companies. We can see services like social media on our phones. We pay for services delivered by companies when we go out to restaurants. But can you really hold a company in your hands?
But these differences are not based on facts or data. They are based on feelings and emotions. And how the information we consume is packaged. Let’s compare a hot real estate market – single family homes on the island of Oahu in the state of Hawaii – to the stock market as represented by the S&P 500 index.
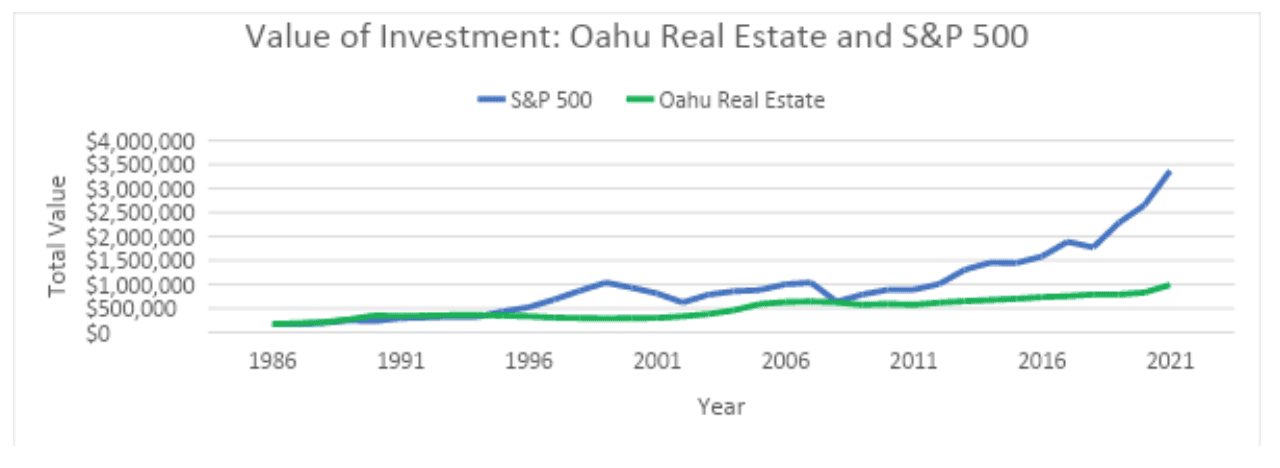
If we look at the data below, we see that if we purchased a median value home in 1986, we would have paid $171,200 for it. If we held onto that home until 2021, we could have sold a median value house for $990,000. That turns out to be a 5.21% annual average gain on our investment. Not too bad. Our investment value went up over $800,000 and all we had to do was sit on it [1]. Of course, when we are sitting on the house, we still have to repair the roof, replace the appliances and fix the leaky plumbing.
| Oahu Historical Single Family Median Sale Price | ||
| Year | Sale Price | Percent Change |
| 1986 | $171,200 | 7.90% |
| 1987 | $190,200 | 11.10% |
| 1988 | $210,000 | 10.40% |
| 1989 | $270,000 | 28.60% |
| 1990 | $352,000 | 30.40% |
| 1991 | $340,000 | -3.40% |
| 1992 | $349,000 | 2.60% |
| 1993 | $358,500 | 2.70% |
| 1994 | $360,000 | 0.40% |
| 1995 | $349,000 | -3.10% |
| 1996 | $335,000 | -4.00% |
| 1997 | $307,000 | -8.40% |
| 1998 | $297,000 | -3.30% |
| 1999 | $290,000 | -2.40% |
| 2000 | $295,000 | 1.70% |
| 2001 | $299,900 | 1.70% |
| 2002 | $335,000 | 11.70% |
| 2003 | $380,000 | 13.40% |
| 2004 | $460,000 | 21.10% |
| 2005 | $590,000 | 28.30% |
| 2006 | $630,000 | 6.80% |
| 2007 | $643,500 | 2.10% |
| 2008 | $624,000 | -3.00% |
| 2009 | $575,000 | -7.90% |
| 2010 | $592,750 | 3.10% |
| 2011 | $575,000 | -3.00% |
| 2012 | $620,000 | 7.80% |
| 2013 | $650,000 | 4.80% |
| 2014 | $675,000 | 3.80% |
| 2015 | $700,000 | 3.70% |
| 2016 | $735,000 | 5.00% |
| 2017 | $755,000 | 2.70% |
| 2018 | $790,000 | 4.60% |
| 2019 | $789,000 | -0.10% |
| 2020 | $830,000 | 5.20% |
| 2021 | $990,000 | 19.30% |
| Average Annual Return | 5.21% | |
| Standard Deviation | 9.73% | |
| Number of years with negative returns | 10 | |
| Largest price decline | -8.40% | |
| Largest price increase | 30.40% | |
Source:https://www.hicentral.com/oahu-historical-data.php
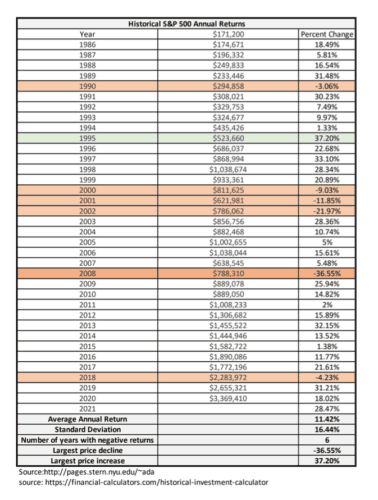
If instead of buying real estate we invested our $171,200 in the companies of the S&P500 index, the value of our investment portfolio would have been $3,369,410 at the end of 2021! Our investment value went up over $3 million and all we had to do was sit on it [2].
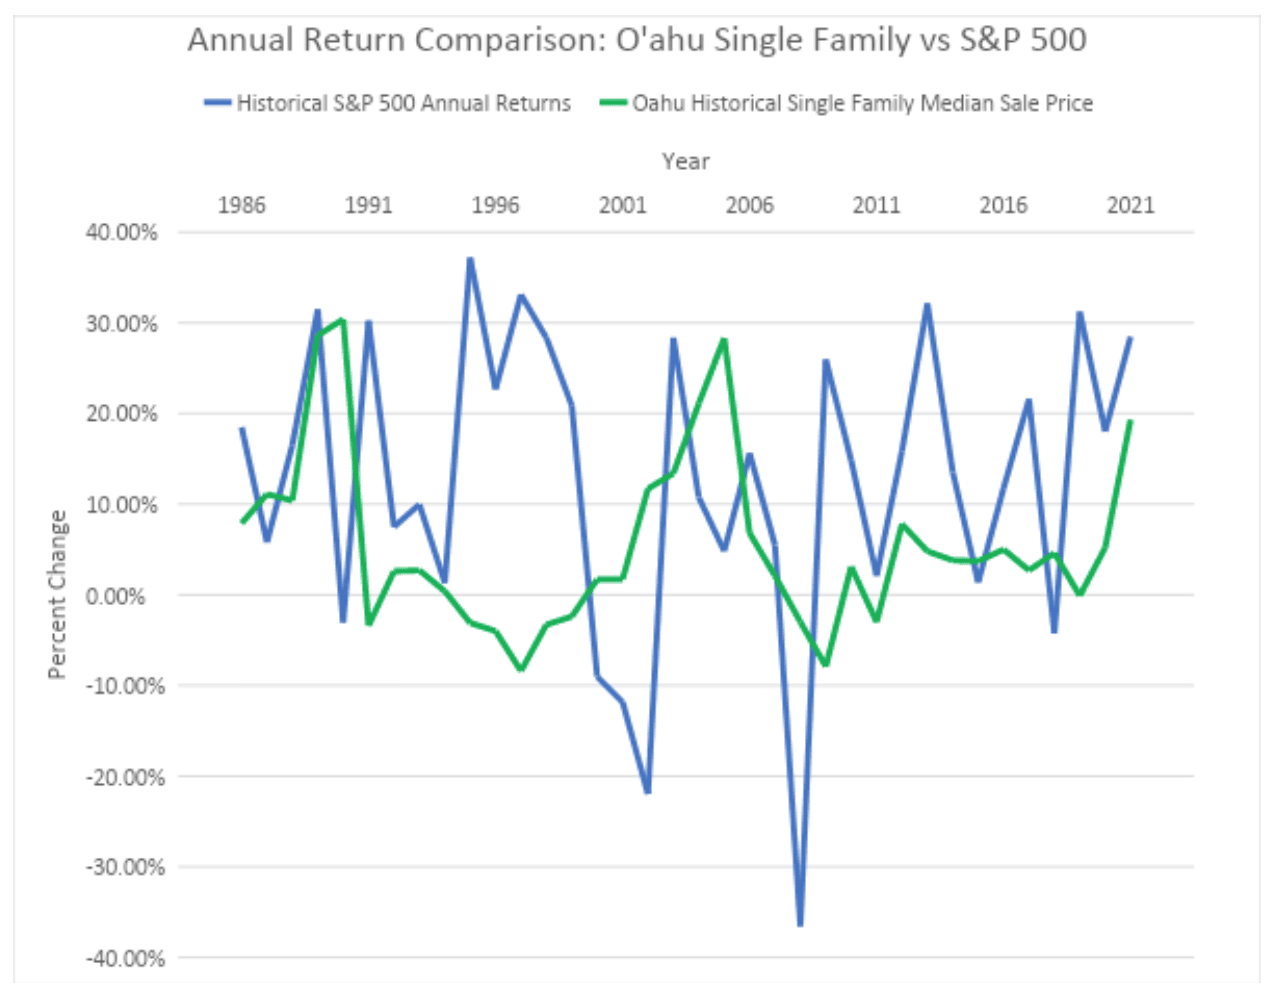
Neither of these investments had positive returns every year. But, when we look at the data we see that real estate actually experienced more years with price declines than the S&P 500 index. However, the stock market was more volatile during that time period with larger ups and larger downs. The stock market had nearly double the volatility of the real estate market. But, be clear – real estate did experience downturns. You likely don’t remember them or didn’t notice them as much for two reasons. First, because you didn’t know the minute-by-minute price of your house, you were likely less focused on that price movement. Second, you probably didn’t sell your house and lock in those losses. But, if you were in charge of your stock portfolio and you were like most average investors, you probably freaked out and sold your investments when they went down to “protect” yourself. Unfortunately, by reacting emotionally, the average investor tends to shoot themselves in the foot and erodes the value of their investments over time.
Now before you @ me, I would like to acknowledge some limitations on this comparison. First, I am simplifying the analysis to just doing a price comparison. One of the unique values of real estate is you can leverage your investment by using debt (aka other people’s money) to control that real estate with a smaller cash outlay. You can of course also buy stocks on margin, which might be comparable. But, when you leverage your investment to get higher returns, whether it is real estate or stocks, you also leverage or increase your risk. Nothing comes for free.
Second, real estate also gives you the option to generate income by renting it out. But, ownership in companies also comes with dividends, which are the profits the companies return to their owners. In our example above, including reinvesting the dividends, our S&P 500 investment would have grown to over $7 million. In the next article, I will explore how leverage and rent changes the returns of real estate.
Lastly, I am using median values when looking at real property. Some of you are going to say, but what about my house in Kailua, Manoa or Portlock? Surely those neighborhoods have fared better. It’s possible. As they say in real estate: Location! Location! Location! One of the risks of real estate is the specific market in which you buy. And if you are only buying a single property, all of your risk is tied up in that single house. Neighborhoods change. Hidden defects emerge. However, the same is true in buying companies. Some companies in the S&P 500 have done better or worse over time. The index itself slowly changes over time as companies are removed and added. By using averages, both for real estate and stocks, I am trying to smooth out the impact of specific choices: both good and bad choices. Also, do not fall prey to the bias of hindsight. It is easy to look backwards and see how obvious it is that a specific investment worked out. Trying to predict what will happen in the future is much more difficult and quite murky.
Now, my point in this article is not to say that real estate is a bad investment. My point is that every investment has advantages and disadvantages. Risks and benefits. And, you should assess those risks and benefits with data and not based on flawed emotional reasoning. Understand the risks completely with open eyes. Know your limitations. And your risk tolerance.
Also, pay attention to how you are consuming information. If watching the daily gyrations of your portfolio is likely to encourage you to make bad decisions, stop watching it! And for the health of your portfolio, please ignore the media pundits who claim to be experts. They loudly proclaim their confidence in their ability to predict the future and make you feel like an idiot for not listening. But, they usually won’t tell you they are wrong more often than not.
Working with a CERTIFIED FINANCIAL PLANNER™ can be a great way to develop a plan before the market goes sideways. They can also help you stick to that plan when the going gets tough and help check your emotional reactions.
- This ignores any transaction cost. While you could purchase the median value home, that home may not be the same home 20 years later represented by the median home value.
- This ignores any transaction cost. You cannot invest directly in the S&P 500 index, but you can purchase the companies represented in that index. The S&P 500 index also changes somewhat over time, so you would need to update your investments to follow that for the numbers to match exactly.